Documentation XFEM4U
Introduction
This page contains the documentation of XFEM4U. It is meant as a full description of all functions and possibilities of the program. Other relevant information about XFEM4U can be found in the following links:
Release Notes
Releasenotes of XFEM4U: [link]
Possibilities and limitations
Full list of features of XFEM4U can be found here.
Chapters user manual
2. Basic concept User Interface
2.1 Design Arrangements and coordinates
5.1.1 Eurocode Steel Joint Design
5.2 Eurocode Reinforced Concrete Design
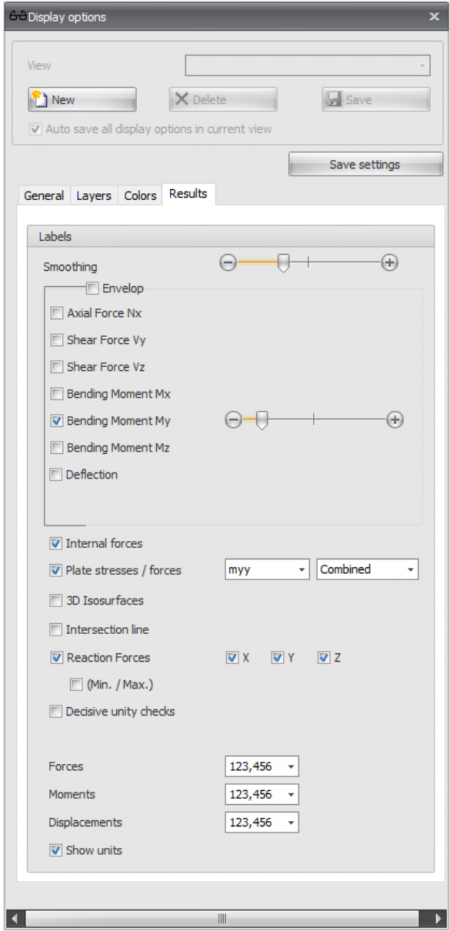
Display options
Views
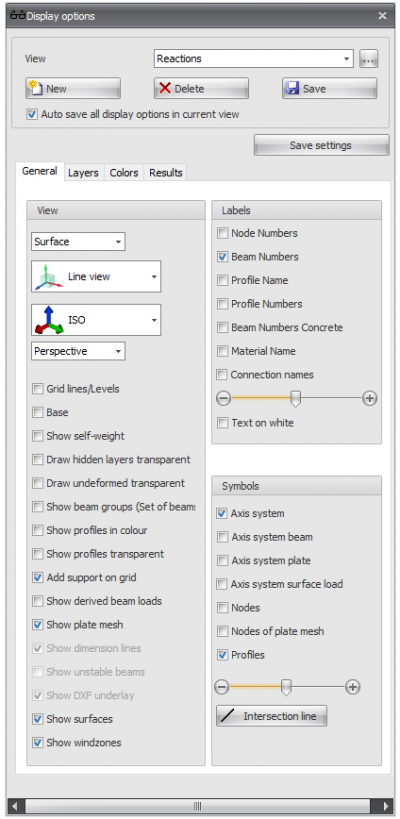
Optional an unlimited number of views can be made. The camera position and all display settings will be stored per view. All views are also saved in the project file input file so that they can be displayed and or included in the output again when the project is reopened. You can of course rename all views. In the output selection you can select the views to be included in the output. All 3d view image of Geometry Loads and Results are automatically placed in the right place. When generating output all selected 3d view images are also saved as a png-file in the map where the project file input file is saved.
View
You can change the view. Name of the view can be adjusted here.
A separate dialog box is displayed where you can change the order of all created views.
Add a new view. The default name is "View 1", "View 2", ... and so on.
Remove a view.
Save Update the actual camera position of the current view. When you change the camera position you need to save this. All display settings are automatically saved in the current view.
Auto save all display options in current view
Setting whether all view options should be automatically saved in the view.
Mesh Surface
Setting whether a mesh or surfaces need to be drawn.
Line view Solid
Setting whether:
- The wireframe and nodes are drawn Line view or that
- all profiles are drawn as solid model in true size Solid model view
Views
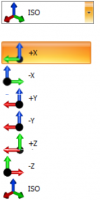
You can change the view. Default is ISO isometric view.
This list also automatically contains all grids and levels. The depth is not yet adjustable and is now 500mm in front and 500mm behind. Only the objects within these distances will be visible.
With the setting perspective/orthographic you can set if you want the view to be in perspective.
Grid lines levels
Grid lines, levels and/or help lines will be drawn. See Gridlines levels.
Base
Setting whether the base needs to be drawn
Show own weight
Setting whether the automatically generated beam loads as a consequence of the own weight need to be drawn in the load case permanent.
Draw hidden layers transparent
When some layers are set to be invisible, the beams in these layers are not drawn anymore. With this setting the beams in the invisible layer can be drawn transparent. This is very convenient for giving presentations.
Draw undeformed transparent
Setting when drawing the deformed construction tab Result: deflection, the undeformed construction needs to be drawn transparent.
Show beam groups
Beam groups that are created See Eurocode can be graphically displayed. Also the lateral supports at the top and bottom flange are displayed.
Show profiles in color
The different profiles can be drawn in a color. Every profile has its own color. By this it can be easily checked if all the profiles are inserted right.
Show profiles transparent
Only in Line view: The profiles are drawn transparent, as solids.
Add support on grid
When drawing a beam, a pinned support is automatically generated when the node is at a grid point.
Show derived beam loads
Using surface loads all beam loads will be generated automatically. You can display all derived beam loads.
Show plate mesh
Setting whether the plate mesh need to be drawn.
Show dimension lines
Setting whether the dimension lines need to be drawn.
Labels
Node numbers
The node numbers are displayed between brackets at the node.
Beam numbers
The beam numbers are displayed at the beam
Profile names
The profile names are displayed at the beam
Profile numbers
The profile numbers are displayed at the beam
Material name
The material names are displayed at the beam
Text on white
Setting whether all the text values are displayed on a white background. By default this function is turned off.
The scale of the text can be set.
Axis
Setting whether the global coordinate system should be drawn.
Axis system beam
The local coordinate system see Design arrangement will be drawn in the middle of the beam. This is important for inserting the beam loads which are entered in the local beam coordinate system. See Beam loads.
Axis system plate
The local coordinate system see Design arrangement will be drawn. See Slabs.
Axis system surface load
View the local coordinate system of the entered surface loads.
Nodes
Only in Line view: Setting whether the nodes should be drawn as dots
Profiles
Only in Line view: Setting whether a little part of the profile should be drawn in the middle of schematic line of the beam.
The scale of the symbols can be set.
Layers
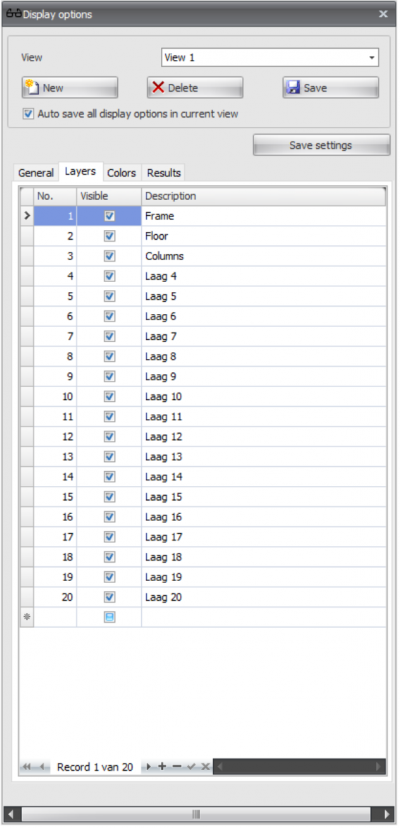
Layers
The layer function works the same as in AutoCAD. Beams can be placed in one or multiple layers. See Beams. The layers can be visible or not. Layers can be renamed.
By making smart use this functionality you can make the graphical input more easy and you will keep overview. Also for giving a 3d presentation, the layers are very convenient.
Tip: Use layers. You will experience that it is convenient and very efficient.
Colors
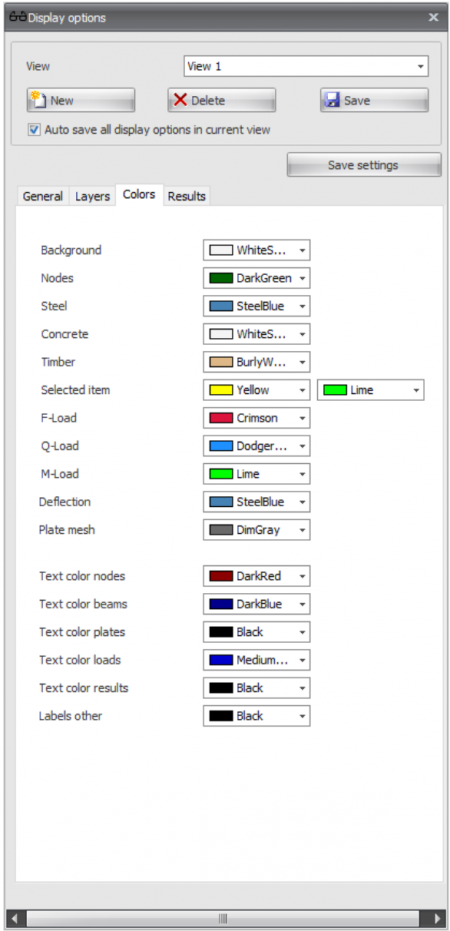
Colors
Here the colors of the different parts can be set.
Results
Smoothing
With the display of the N- V- and M-lines and the deformations, the beam is divided in to multiple beam parts. This amount can vary between minimal 3 parts to a maximum of 30 parts. By default this value is set to 10.
Envelop
Allows you to display envelop Nx-, Vy-, Vz-, Mx-, My-, Mz- and deformation lines.
Axial force Nx
Drawing of the Nx-line. The scale can be set.
Shear force Vy
Drawing of the Vy-line. The scale can be set.
Shear force Vz
Drawing of the Vz-line. The scale can be set.
Bending Moment Mx
Drawing of the Mx-line. The scale can be set.
Bending Moment My
Drawing of the My-line. The scale can be set.
Bending Moment Mz
Drawing of the Mz-line. The scale can be set.
Deflection
Drawing of the deflection line. The scale can be set.
Plate stresses forces
Drawing of the plate stresses and forces in colour. A colour scale appears on the left. It can be set which stress or force is to be displayed. Stresses can be displayed as membrane, bending or combined.
3D Isosurfaces
Display the plate stresses and forces three-dimensionally.
Reaction Forces
Drawing of the reaction forces in all the supports. It can be set which directions need to be drawn. By default all the directions x,y and z are drawn.
Decisive unity checks
Per beam the unity checks can be displayed. These are results form the check according to the Eurocode steel. When the unity check is less than 1,00 the beam meets the criteria, and a green dot is drawn. button_ok. When the unity check is greater than 1,00 the beam does not meet the criteria and a red trianglewarning 16x16 is drawn.
Note. When you double click on the dot triangle, a detailed calculation of the concerning beam is shown.
Min.Max.
Minimum and maximum value of the unity check. Only beams with a unity check that lie between the minimum and maximum value are represented graphically.
Forces
Moments
Displacements
It can be set how many decimals should be displayed.
Find
The Find feature makes it quick and easy to find a node, beam or profiles.
How does that work?
You choose Nodes, Beams or Profiles. The combo box is filled with the visible nodes, beams or profiles. The whole model is drawn transparently except for the node, beam or profiles you are looking for. It is very intuitive.
To change the node or beam you can also click on the node or beam in the 3d model.
Dockable windows
What are these? Dockable windows are windows that can be moved freely or placed on fixed spots. (left/right/top/bottom of the screen)
The tables for Geometry (Grid lines / Levels, Nodes, Profiles and Beams) and the tables for Loads ( Load combinations, Beam lodes, Node loads and Combinations) can be displayed or not.
You can enter your construction fully graphically, whereby the use of tables is not really necessary. Nevertheless it can be handy to see, for instance, the node coordinates in tables. This is possible. But in contradictory to many other programs you can also make any changes in these tables. It does not matter. Graphical drawing or numerical input via tables can be done simultaneously. After each change, all tables are updated and the construction is redrawn. Of course the undo and redo functions still work.
The windows can be set as 'floating' (in a random position but also outside the screen) or can be 'docked' left/right/top/bottom in the main window. This gives you much freedom. You can decide for yourself what you find most pleasant. The program remembers this setting, so you only have to do this one time. Of course you can always change this.
For example, when you have two computer monitor, you can show the construction graphically in full screen on one monitor, and show the tables on the other monitor.
Dockable windows
Changing dimensions or values in the graphical view
- Move your cursor on the number in the dimension line.
- When the dimension line gets its focus, the number is viewed bold. The color of the dimension changes from gray to black.
- Press left mouse button. A dialog appears with the number to be edited.

- Change the value.
- Press.
 The dialog will be closed and the dimension has been changed.
Beam grid concrete
With XFEM4U you can easily design a beam grid or a piled concrete foundation, and optimize its design.
Pile distances
In this screen you can adjust the pile distances. You can do this in 2 ways.
- by clicking on the dimension line and entering a different distance, or
- by dragging the support point graphically with the mouse.
After changing this, the beam grid is automatically recalculated and so you see the result immediately. immediately.
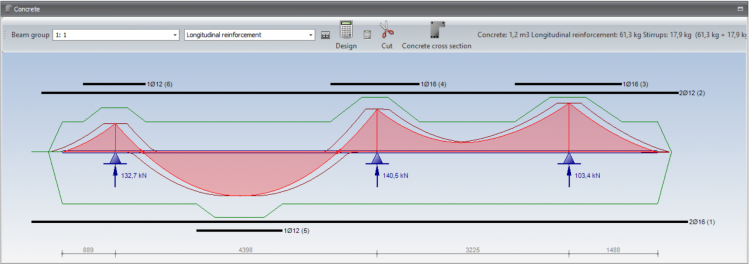
Longitudinal reinforcement
The required additional longitudinal reinforcement is automatically designed. In this tab the reinforcement is shown and you can also adapt all reinforcement. Both the basic reinforcement and the additional reinforcement.
Adapt the reinforcement bars
Double click at the reinforcement bar with the left mouse button. A dialog box is opened.
You can choose between "amount x diameter" , "diameter - ctc distance" of "mm2"
Extend/shorten the reinforcement bars
Go to the end of the bar with your mouse. The cursor changes and you can easily extend / shorten the bar.
Relocate the reinforcement bars
Relocate your mouse to the reinforcement. The cursor changes and you can easily relocate the bar.
Copy reinforcement bar
Relocate your mouse to the reinforcement. With the right mouse button you open a context menu, select copy.
Remove reinforcement bar
Relocate your mouse to the reinforcement. With the right mouse button you open a context menu, select remove.
Menu
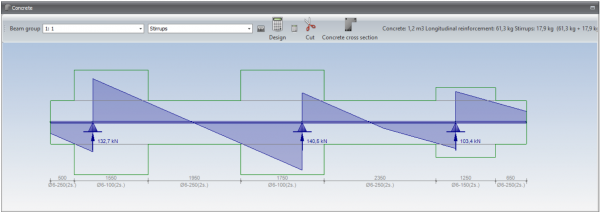
Beam group
Here you can select the beam which you want to be displayed. You can also click on the concerning beam in the 3d display. This beam is shown in yellow.
Longitudinal reinforcement/ stirrups
You can choose to display the longitudinal reinforcement or the stirrups.
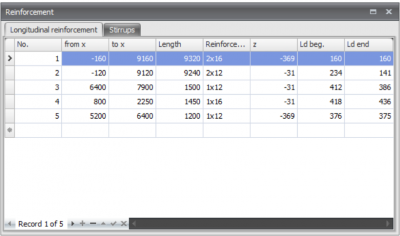
![]() Show a moveable screen with the reinforcement tables
Show a moveable screen with the reinforcement tables
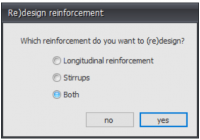
With this function you can re-design the reinforcement of this beam. This may be necessary if, for example, you have adjusted the geometry or load.
With this function you can re-design the reinforcement of all the beams.This may be necessary if, for example, you have adjusted the geometry or load.
You can cut the reinforcement bars.
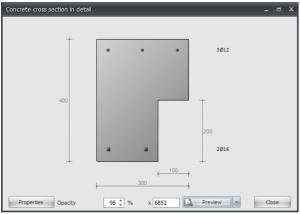
With this function you can ask for a drawing and detailed calculation of every cross section.
Choose for Preview if you want to obtain a detailed calculation
Stirrups
The stirrups are automatically designed based on a combination of shear force and torsion.
The center-to-center stirrup distances and the area over which the stirrups run can be changed graphically by clicking on the appropriate dimension line.
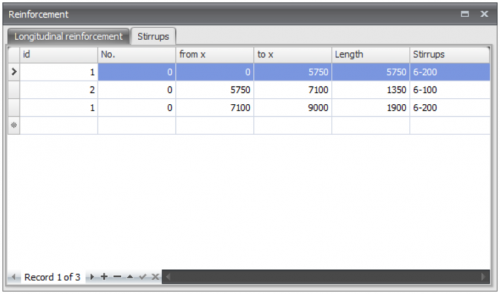
![]() The stirrups can be adapted in the table as well.
The stirrups can be adapted in the table as well.
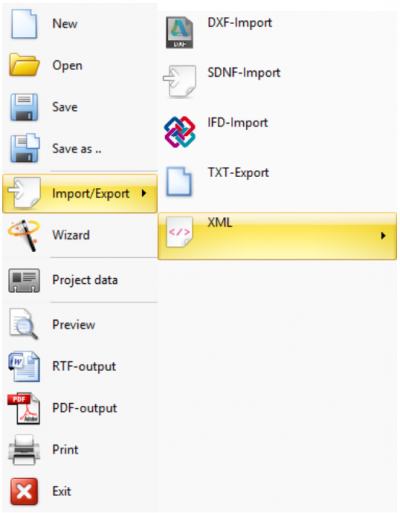
Export/Import
SNDF
SDNF import
DXF
DXF-import
IFD
This is not available yet
TXT
The output of nodes, profiles and beams to an ASCII file
Format:
3
1;6000;3000;0
2;6000;9000;0
3;9000;9000;0
1
1;IPE200
2
1;1;2;1
2;2;3;1
XML
XML - import
XML - export
format: Make an XML-export of an input
Back-up files
When you save a project, XFEM4U makes a backup copy of the previous version of the project (that is, the project file before the current save). This backup copy has the name "_backup<nnn>_"<project_name>.xfem, where <nnn> is a 3-digit number indicating how many times the file has been saved. The backup files reside in the same folder as the project file. The number of backup files is 3.
Results
By pressing the calculate button ![]() or selecting the tab Results your construction is calculated automatically.
or selecting the tab Results your construction is calculated automatically.
On tab Results:
Highlight combination
Here you can select the load combination or the load case which you want to be shown.
In ![]() display options you can choose what you want to see. See Display options
display options you can choose what you want to see. See Display options
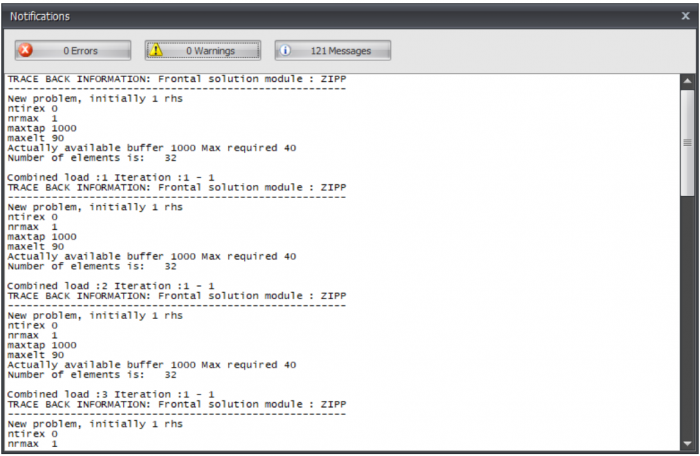
When the force distribution can not be calculated, for instance when the construction is instable, a dialog box is opened. This dialog can be reopened with the button shown above. In this dialog box the notifications of the calculation module are shown.
By the use of the spy you can look at the results of a certain beam in more detail.
See Spy.
Calculation settings. See Calculation settings.
Optimize steel profiles.
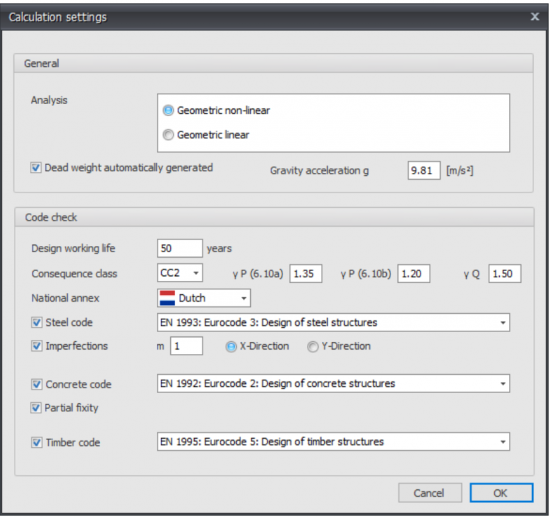
Calculation settings
Analysis
You can choose between two types of analysis: Geometric non-linear (GNL) or Geometric linear (GL). When you have chosen for a check according to the Eurocode (timber and steel), the analysis is always Geometric non-linear (GNL).
Dead weight
You can choose if you want the dead weight to be automatically generated or not.
Gravity acceleration g
Gravity acceleration in m/s2.
Code check
Design working life
The design working life of the construction in years
Consequence class
The consequence class of the construction. This determines among other things, the load factors that need to be used.
National Annex
The national annex can be chosen by land.
Steel code
The steel code you want to use
Imperfections
It can be set whether you want to take imperfections into account or not.
m
is the number of columns in a row including only those columns which carry a vertical load NEd not less than 50% of the average value of the column in the vertical plane considered
See Eurocode EN 1993-1-1 art. 5.3.2 Imperfections for global analysis of frames. In XFEM4U all node coordinates will automatically be corrected/adjusted with +dx and -dx. So all UGT combinations will be automatically calculated twice. One with imperfections in positive direction, and one with imperfections in negative direction. Furthermore, in XFEM4U all Eurocode design checks are based on a geometrically non-linear analysis. Imperfections (initial sway imperfections) will be automatically included in calculating load combination(s). This is a very accurate calculation method and is applicable for every type of frame. Sway or braced/non-sway frames. In addition, there is no need to calculate (error-prone) buckling lengths any more. The geometrical non- linear analysis (Second-order analysis) ensures global buckling stability check.
In XFEM4U global initial sway imperfections according to EN 1993-1-1 art. 5.3.2 (3) a) are taken into account automatically. The beam imperfections according to EN 1993-1-1 art. 5.3.2 (3) b) are NOT taken into account. This means that the individual stability of all beams needs to be checked according 6.3. The buckling length can be assumed equal to its beam length since the calculation is based on analysis, including global second order effects and global imperfections. See EN 1993-1-1 art. 5.2.2 (7) b).
Concrete code
The concrete code you want to use
Partial fixity
Specific for concrete setting if partial fixity should be taken into account.
Timber code
The timber code you want to use
Optimize steel profiles
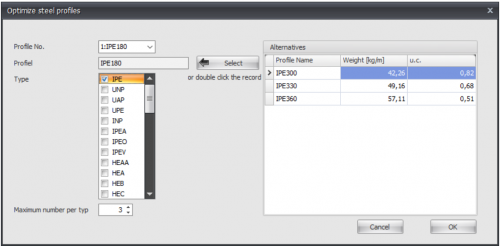
With the function optimization you can very easy and quick create an optimal design of your steel construction. This function can spare you a lot of steel kilos.
How does that work?
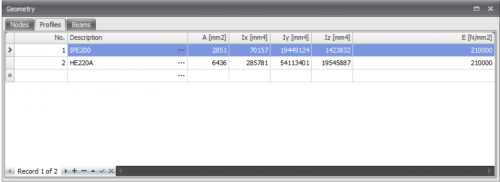
You will go through all the profiles (in the table Profiles ) as you have inserted before. See Beams
The alternatives per profile will be shown directly. From these alternatives you can select another profile.
Profile No.
The profile number refers to the profile number in the table Profile shown below
Profiles
Profile
The chosen profile
Type
Here you select the profile type (or group) in which there can be searched for alternative profiles.
Maximum number per type
Here you can enter the maximum amount of alternatives per profile type. Standard this value is at 3, but you can vary this value.
Hereby you choose a profile from the right table Alternatives. You can also double click on the line in the table to choose the profile
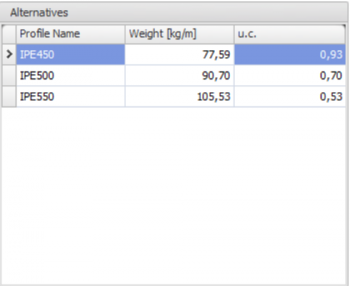
Alternatives
In this table the possible alternatives are directly shown. By default the table is sorted by the unity check (u.c.). This unity check is the normative check according to the Eurocode EN1993. It is also possible to sort the table by profile name or weight by clicking on the column text.
Remark: By changing the moment of inertia, the force distribution also changes. The optimization function does not take this in to account. It could be possible that the new selected profiles will not be sufficient for your design and you have to use the optimization again. However, you will experience that the optimal design will be determined quick and easy.
Menu
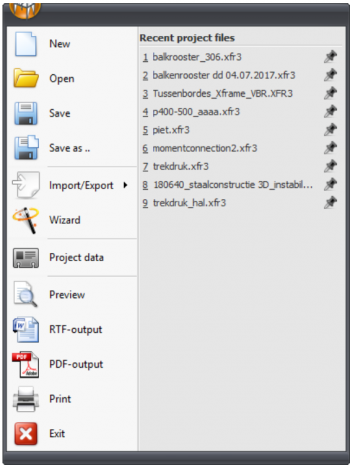
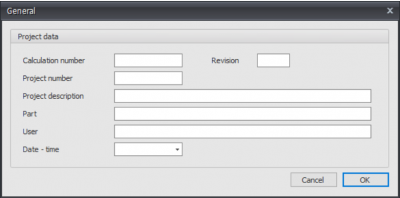
Project data
Preview
Menu: File > Preview
The dialog box of the print preview offers, next to the standard functionality, many extra's including directly creating an e-mail with the calculation in PDF-format attached. From this functionality you can also generate a PDF-file or add a watermark in the output file.
